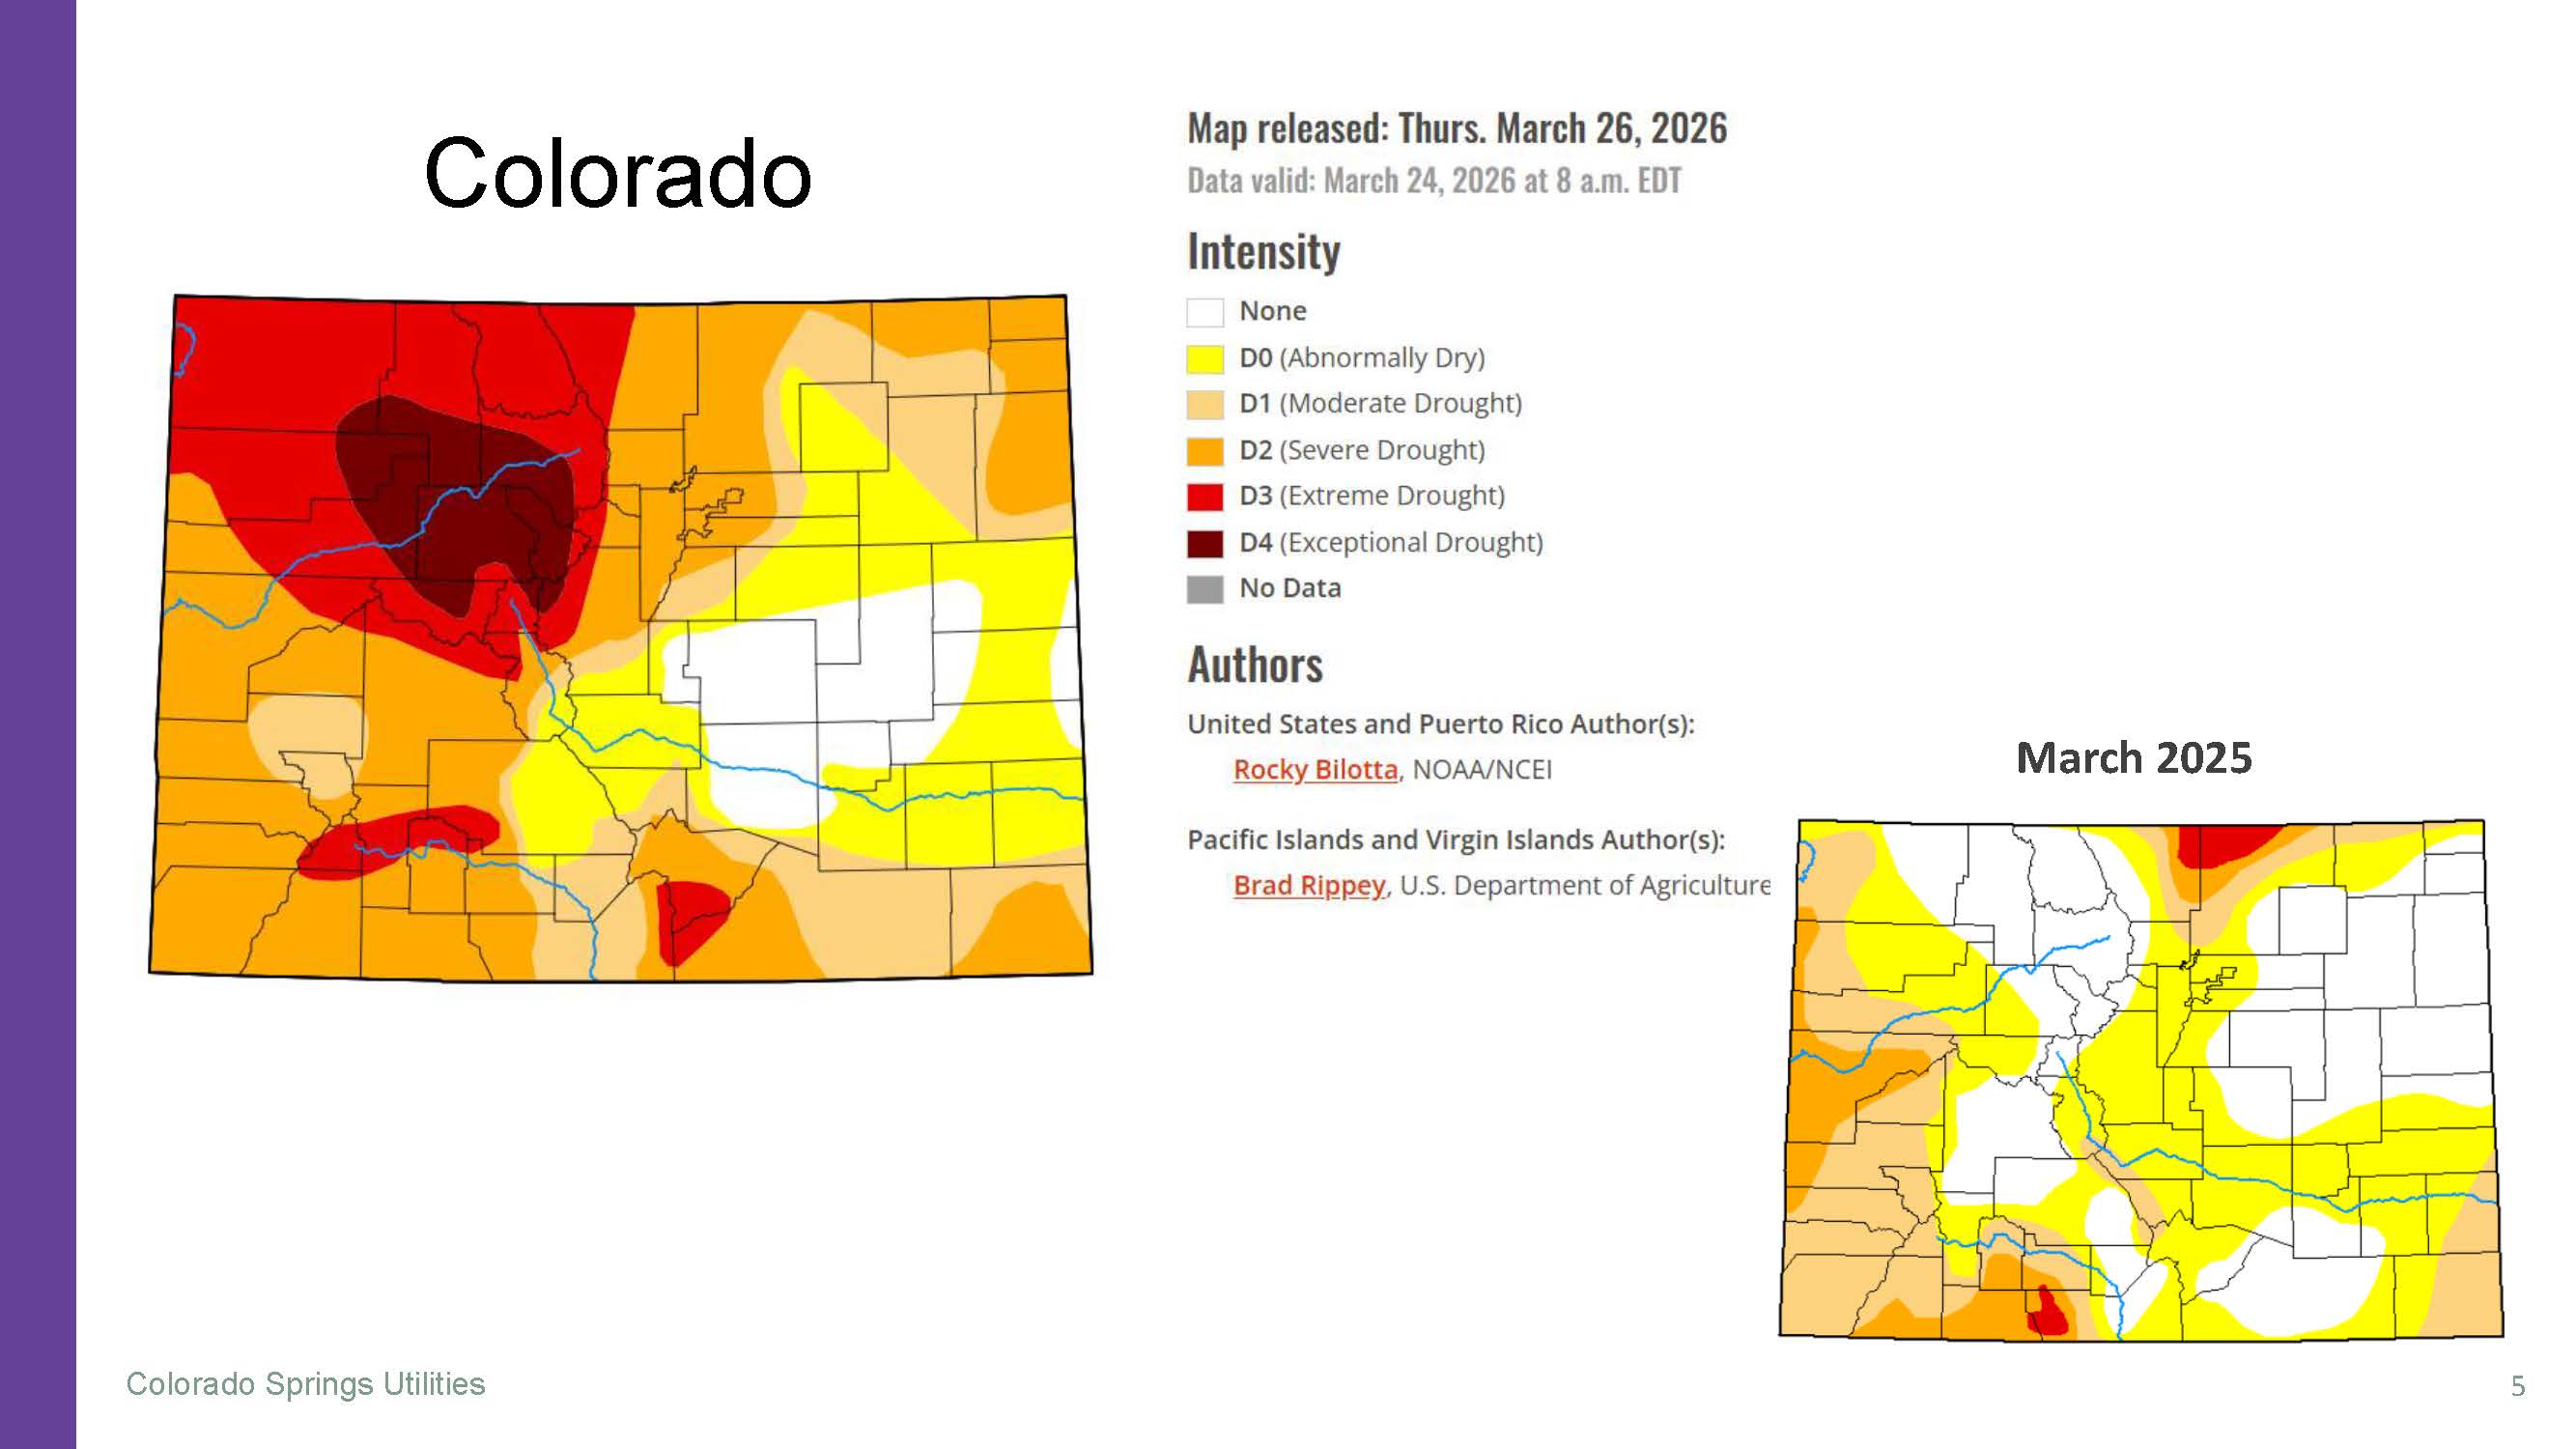
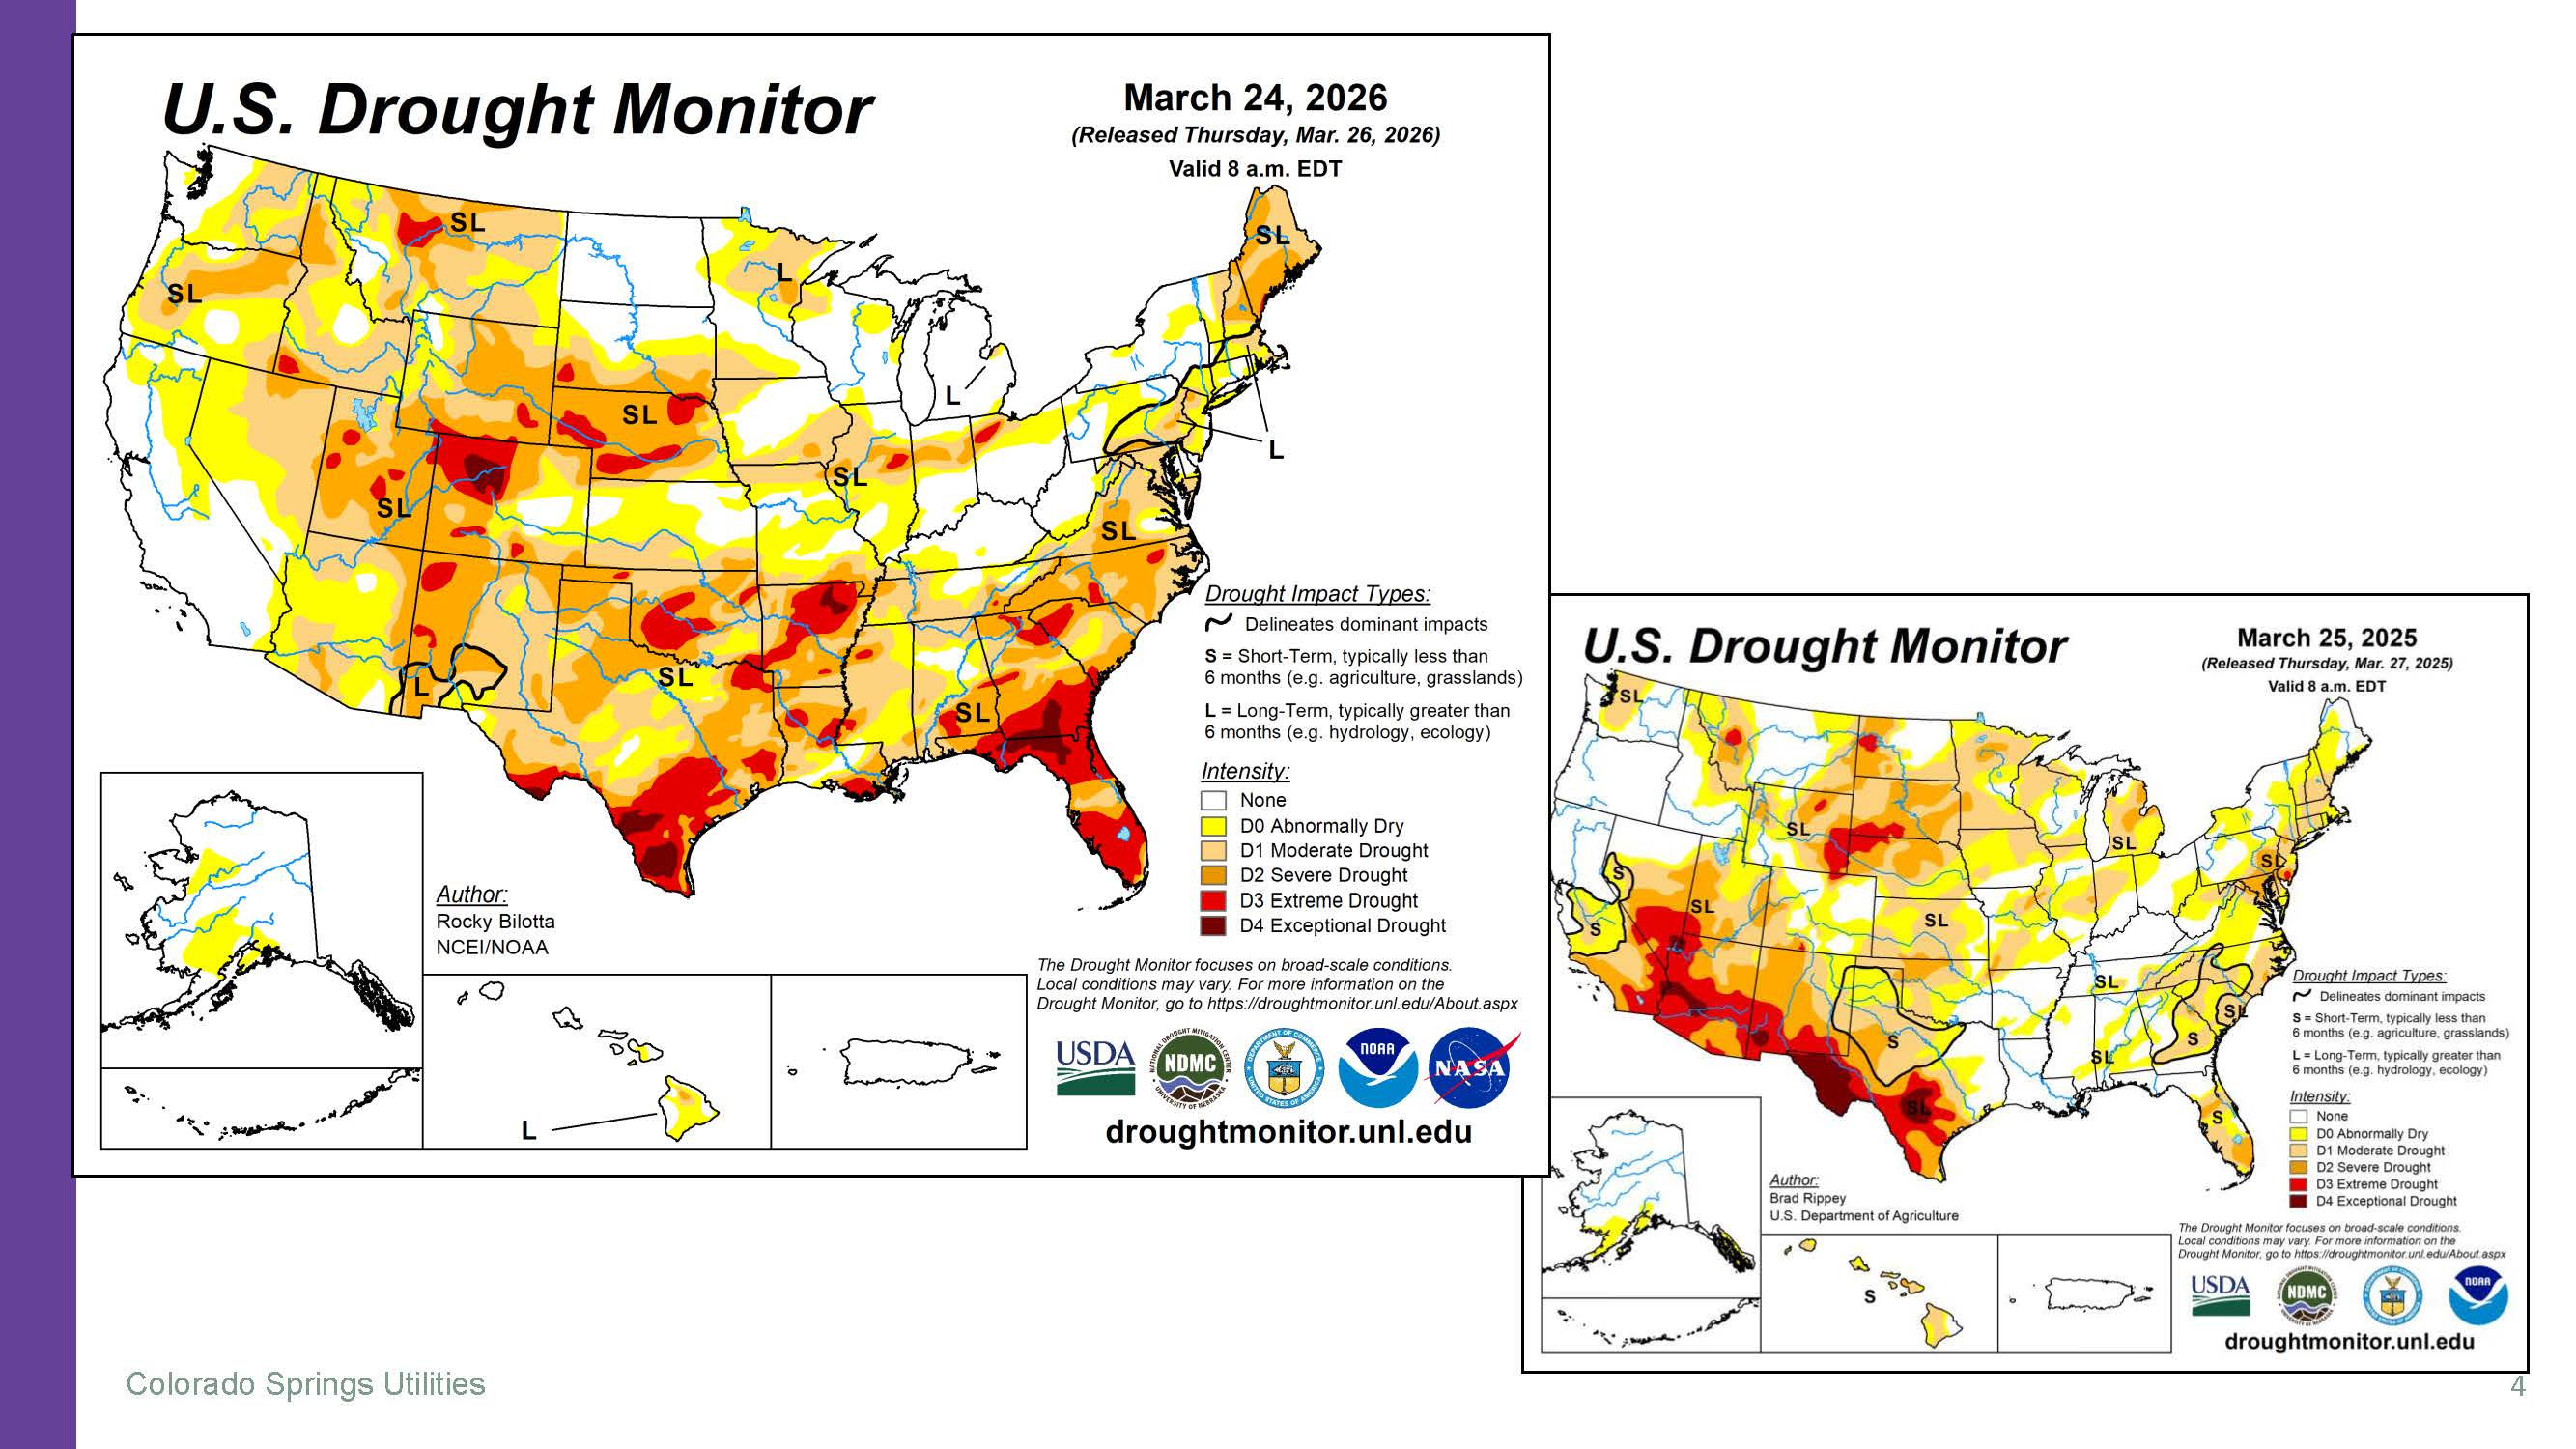
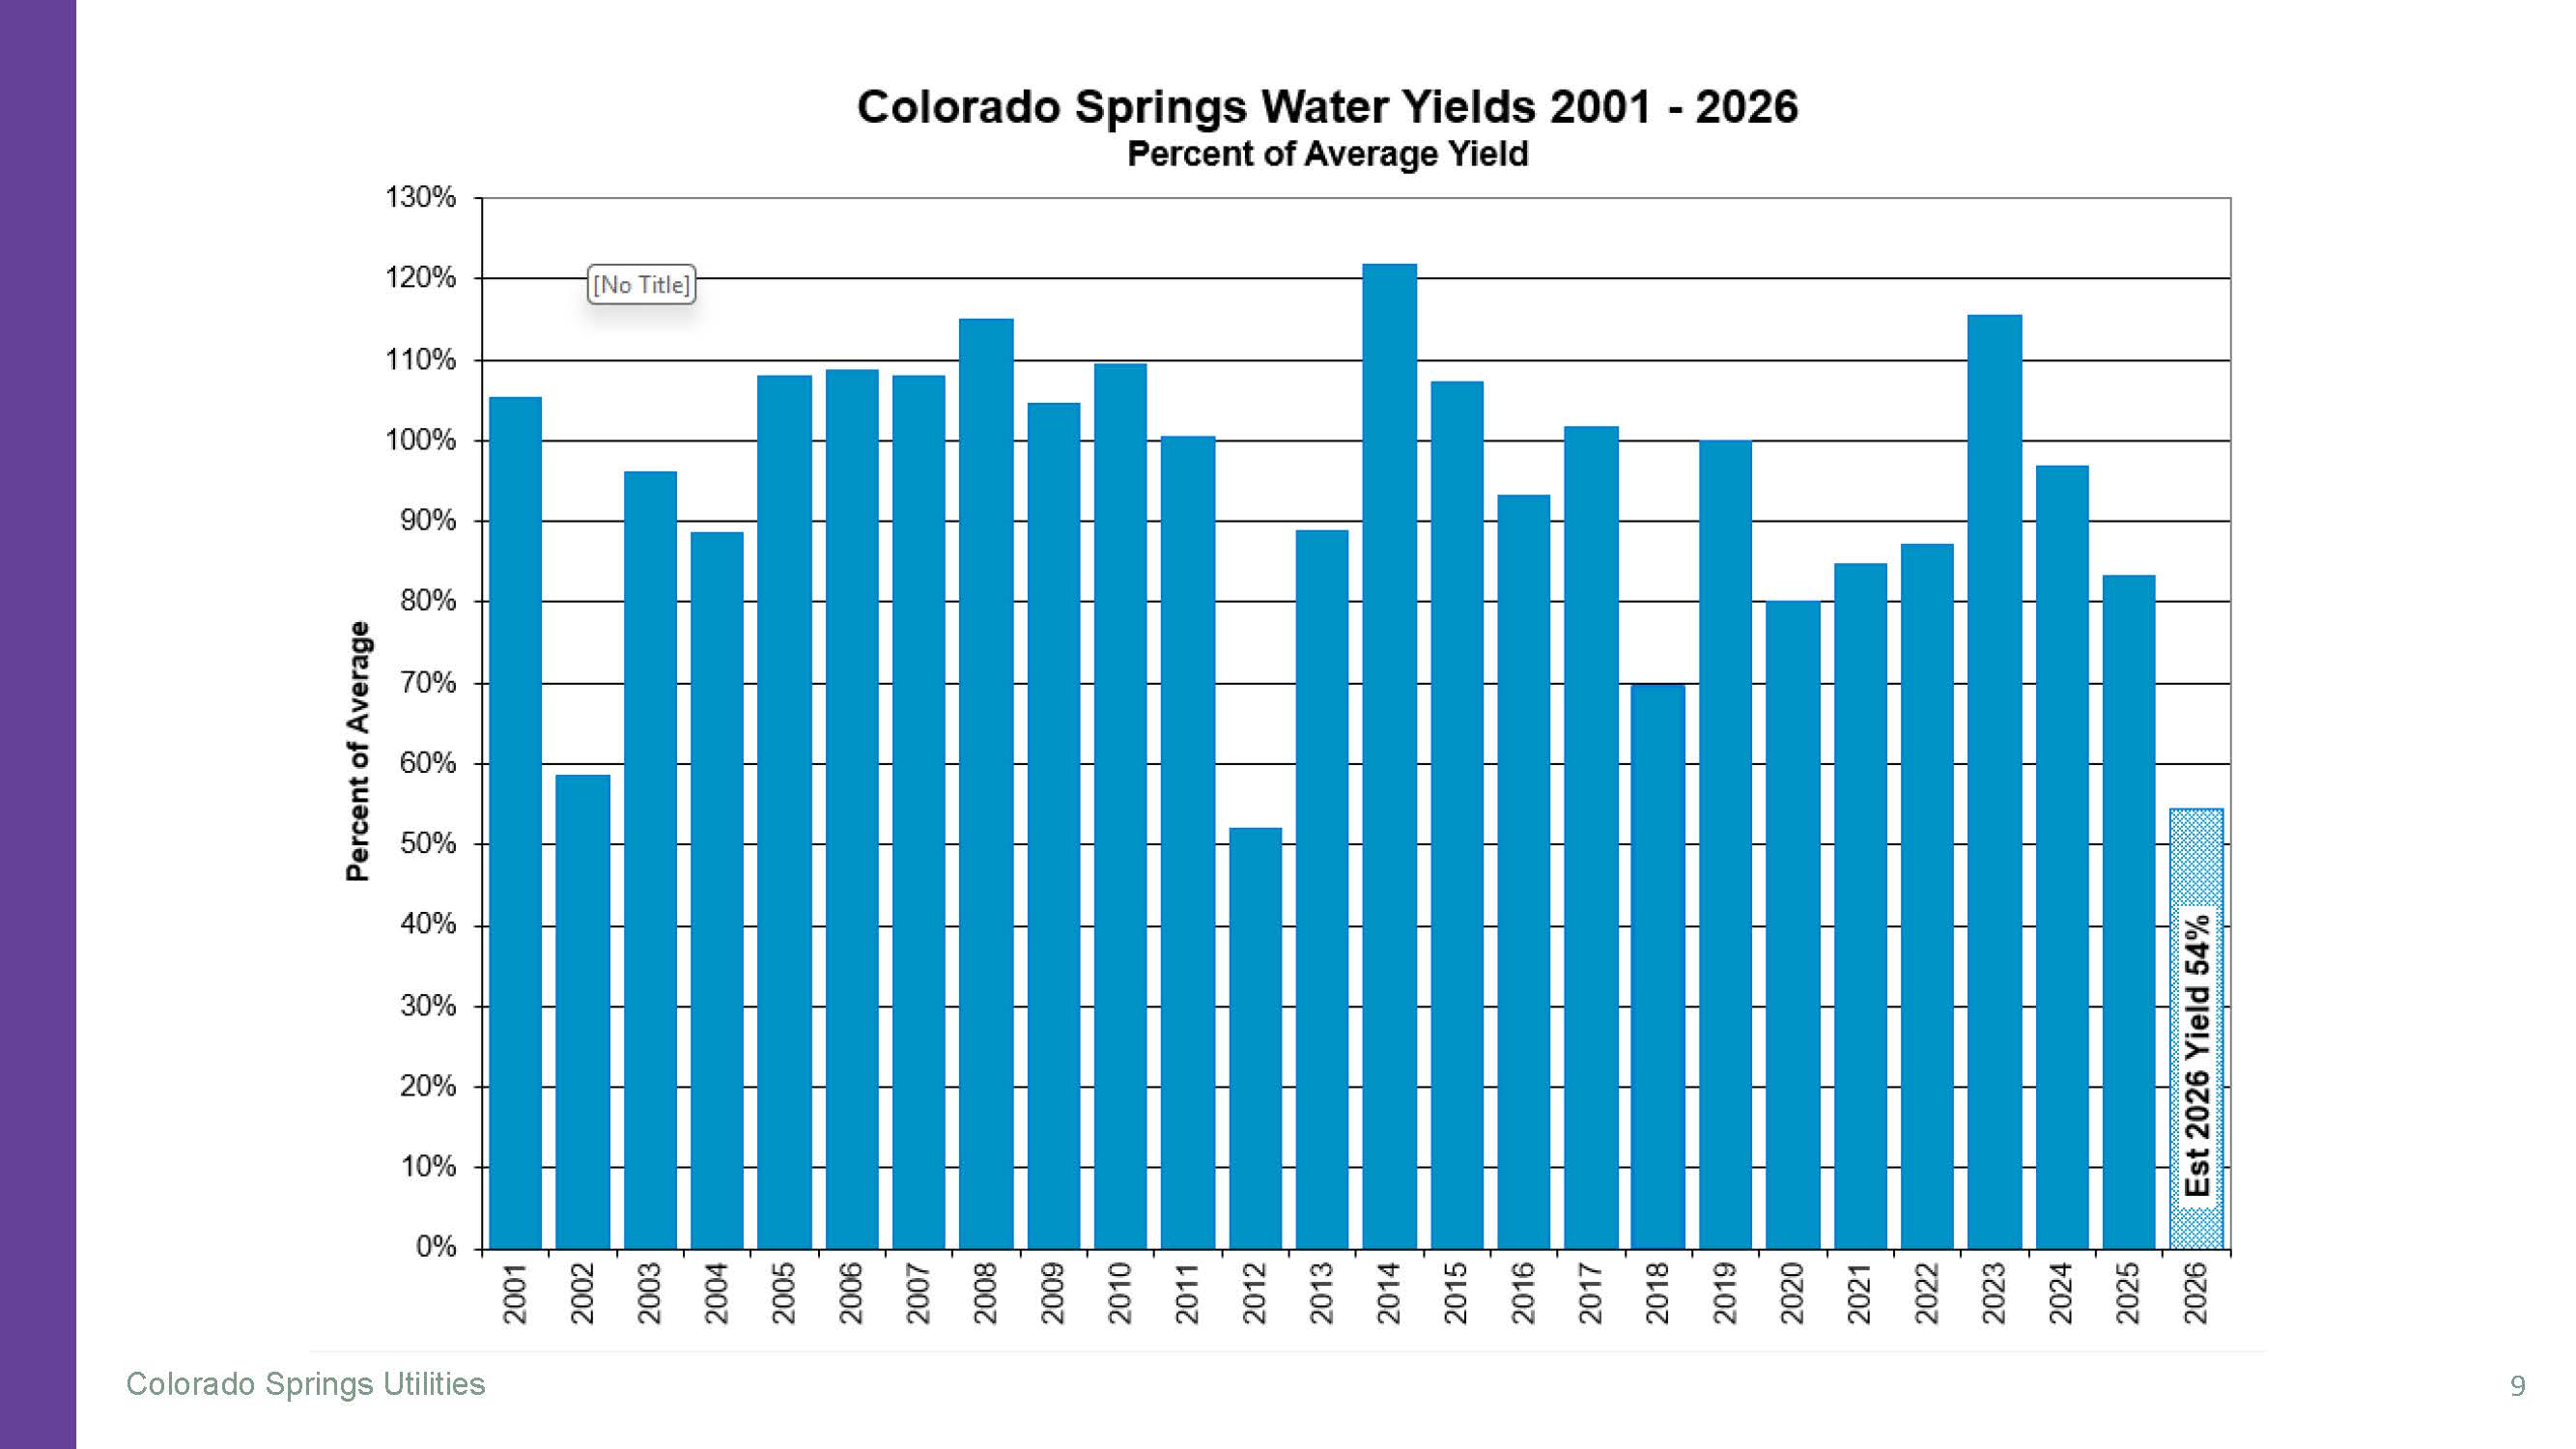
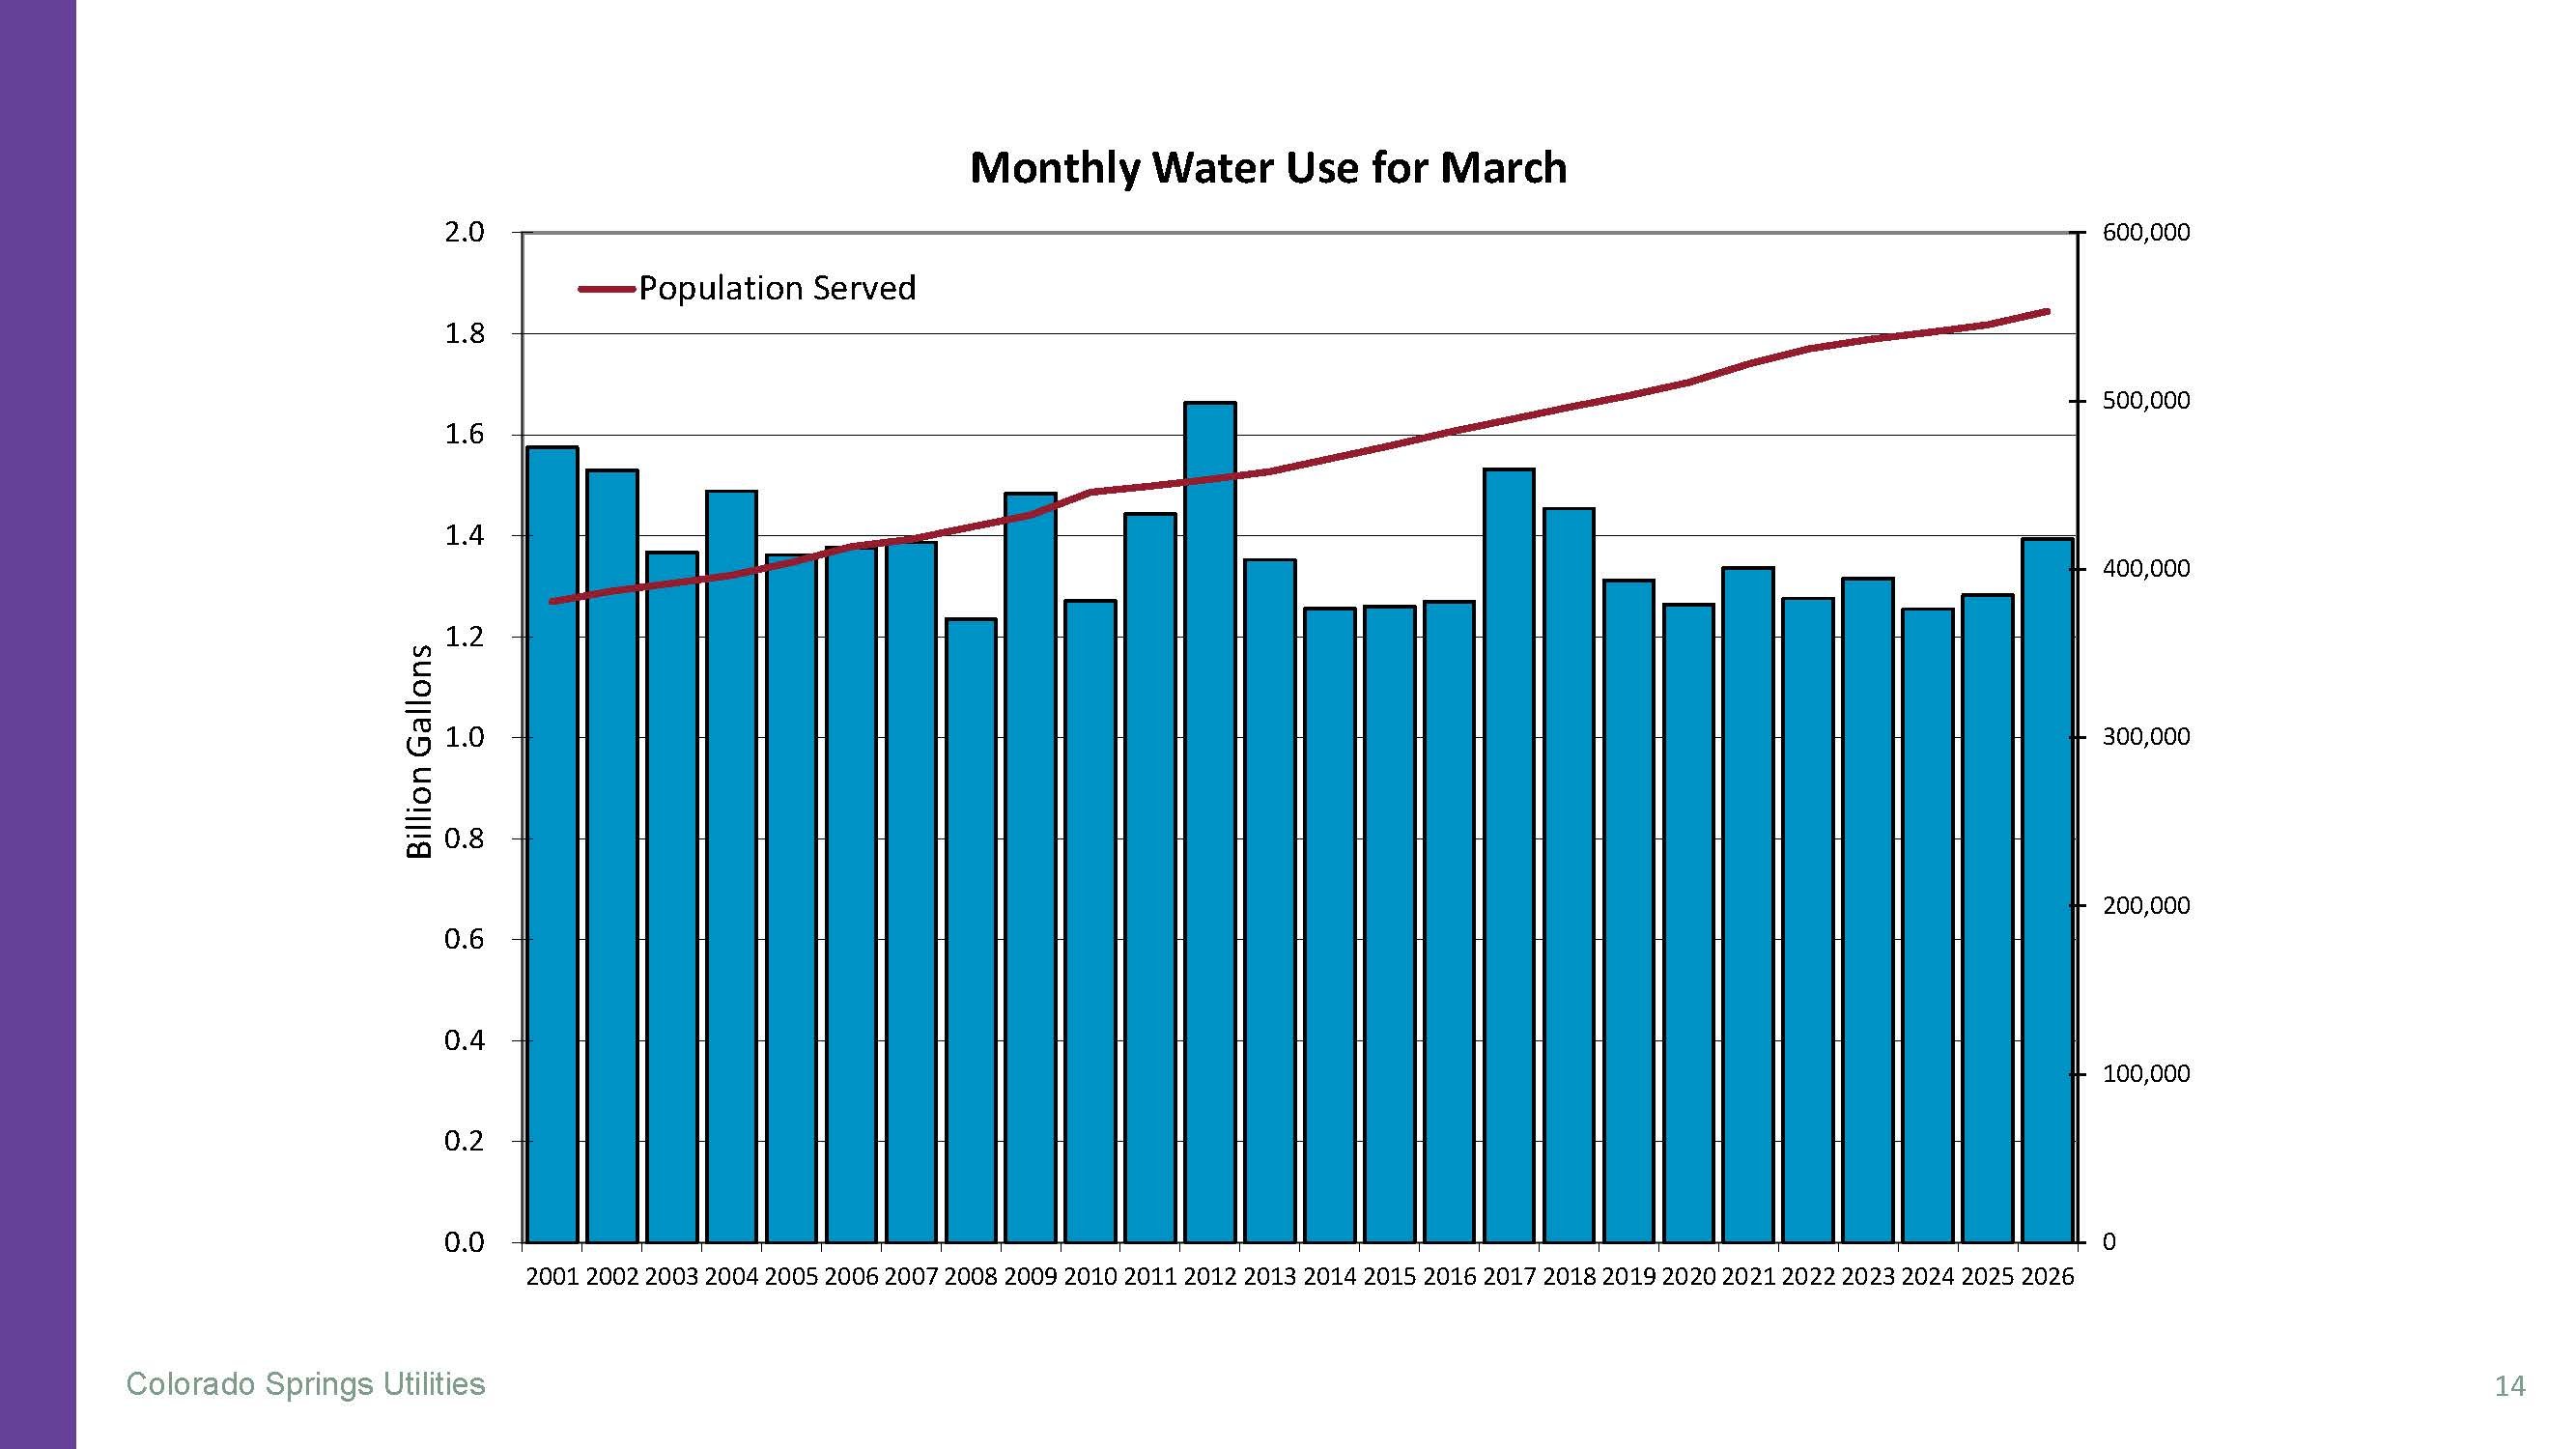
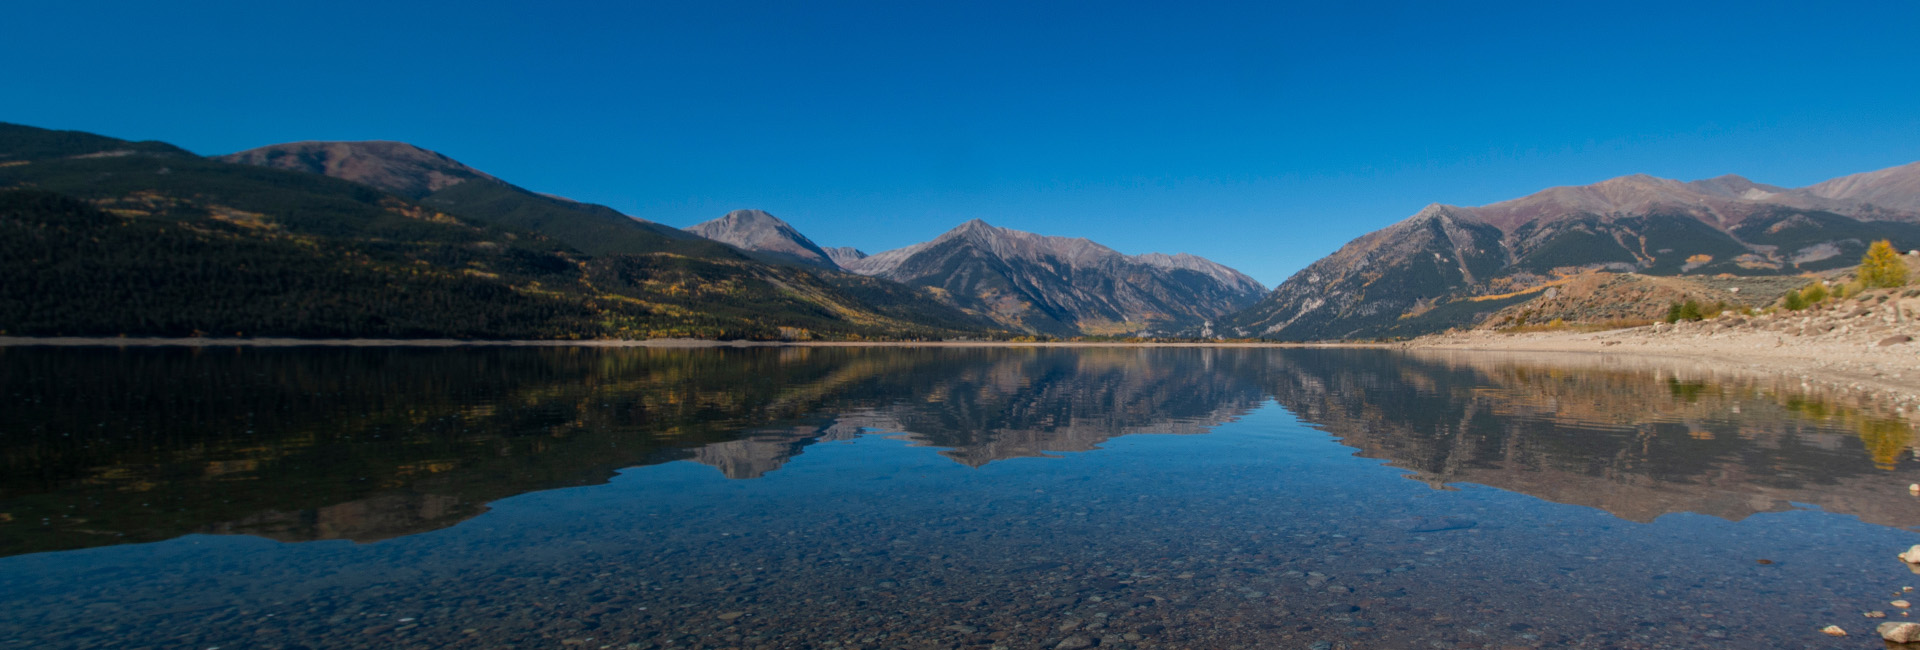
As your local water provider, we have a responsibility to maintain and protect your water supply to help ensure the health, safety and economic vitality of our community. We carefully monitor several factors to determine our current supply of water, including levels of our reservoirs, snowpack and forecasted stream flow.
| Precipitation | Temperature (Average) |
Demand | Reservoir Levels |
Demand in Storage |
| November 1.20 inches (324.3% of normal) |
November 45.9 degrees (6.4 degrees above normal) |
November 42.3 MGD* (1.5% more than November 2024) |
Pikes Peak: 47% Rampart: 63% Local Total: 56% System Total: 78% |
Local: 198 days System: 2.9 years |
|
Year-to-Date 15.86 inches |
Year-to-Date 52.6 degrees (0.4 degrees above normal) |
Year-to-Date 61.4 MGD* (1.6 billion gallons less than 2024) |
||
| As of Dec. 1, 2025 | *MGD = Million Gallons/Day | |||